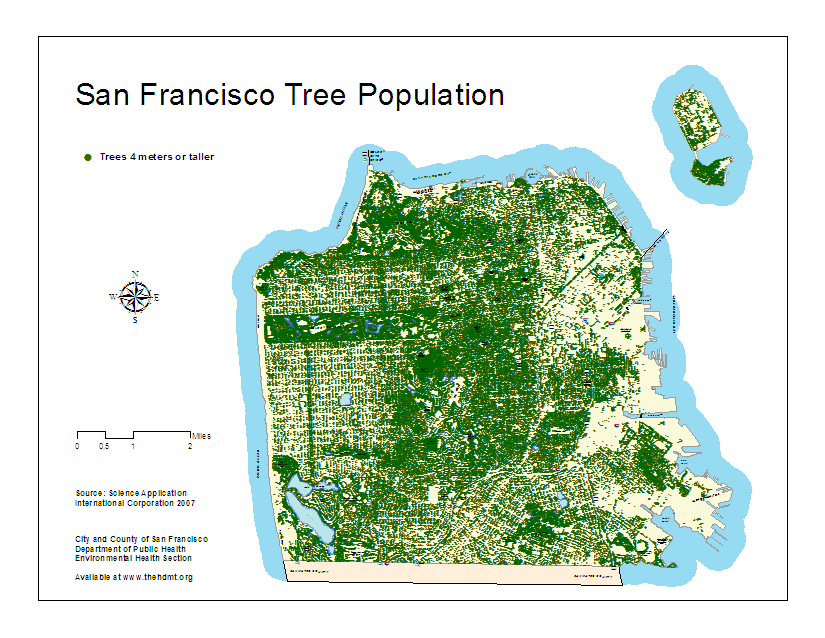
Indicator En.2.c Total trees
Descriptive Title: Number of trees four meters tall or higher
Geographic Unit of Analysis: Point

![]() Download PDF map.
Download PDF map.
Why Is This An Indicator Of Health and Sustainability?
Trees provide natural cooling through the shading of streets and buildings thereby reducing exposure to UV radiation and the risk of skin cancer, as well as energy demand and consumption. Trees also capture air pollution, reduce carbon dioxide, increase oxygen, and help capture storm-water runoff, filtering water to reduce the amount of mercury, oil, and lead going into the Bay. Trees can also serve as buffers to traffic, reducing pedestrian injuries. Several studies show that the presence of forests, trees and other vegetation improves adult recovery from mental fatigue, leading to a reduction in socially unacceptable behavior and crime, as well as fewer behavior problems among children.a,bInterpretation and Geographic Equity Analysis
In 2004, the San Francisco Urban Forest Council invited a research team from the United States Department of Agriculture (USDA) Forest Service to study San Francisco's urban forest. The team's report, issued in early 2005, was the first comprehensive analysis of San Francisco's urban forest, that is, all of the trees growing within the city limits. The study calculated the surface area covered by tree canopies in San Francisco and found that forest canopy covers approximately 12% of San Francisco. This compares to 10% in Los Angeles, 27% in New York City, 28% in Chicago and 34% in Seattle.
San Francisco’s tree canopy is comprised of all trees found within city limits, located on a mixture of public and privately owned land. It is owned and managed by a diverse mix of city, county, state and federal agencies, as well as the private sector.
There is an average of seven trees per acre in San Francisco but that number changes considerably between neighborhoods. Neighborhoods with less than five trees per acre include Mission Bay (2), South of Market (2), Bayview (3), Chinatown (3), Crocker Amazon (4), Downtown/Civic Center (4), Nob Hill (4), Outer Sunset (4) and Parkside (4). Golden Gate Park has the highest number of trees per acre (15) in the city.
Methods
Tree data is from LIDAR. LIDAR data is remotely sensed high-resolution elevation data collected by an airborne collection platform. Using a combination of laser range finding, GPS positioning and inertial measurement technologies, LIDAR instruments are able to make highly detailed Digital Elevation Models (DEMs) of the earth's terrain, man-made structures and vegetation. The data represents individual trees represented as points.
Limitations
Users should be aware that temporal changes may have occurred since this data set was collected and some parts of this data may no longer represent actual surface conditions. Users should not use this data for critical applications without a full awareness of its limitations.
Tree canopy cover is not the only measure in appraising a city’s urban forest. It is equally important to collect quantitative information on tree size, age distribution, tree species, and tree condition. The city is currently collaborating with the United States Department of Agriculture (USDA) Forest Service to obtain this information.
Data Source
LiDAR Tree data provided by Science Application International Corporation and the Federal Bureau of Investigation, 2007.
Map prepared by City and County of San Francisco, Department of Public Health, Environmental Health Section using ArcGIS software.
For more information about trees in San Francisco, visit: http://www.sfgov.org/site/uploadedfiles/bdsupvrs/leganalyst/021-00_Tree%20_Programs.pdf.
See also, Seattle’s Urban Forest Assessment Sustainability Matrix (July 2000): http://www.ci.seattle.wa.us/environment/documents/sustainability%20matrix.pdf
Table data is presented by planning neighborhood. Detailed information regarding census data, geographic units of analysis, their definitions, and their boundaries can be found in the SCI at the following links:
https://SustainableSF.org/etc/Geographic_Units_of_Analysis.pdf
https://SustainableSF.org/data_map_methods.php
- Kuo FE, Sullivan WC. Environment and crime in the inner city: does vegetation reduce crime? Environment and Behavior. 2001;33(3):343-367.
- Taylor AF, Kuo FE, Sullivan WC. Coping With ADD: The Surprising Connection to Green Play Settings. Environment and Behavior. 2001;33(1):54-77.
